






Adelaide Oval pitch report: records, stats and eight pink-ball wins from eight
Adelaide Oval had a reputation as one of the easiest Test pitches in Australia until the pink ball arrived. This is its pitch report, the records in every format, and Australia’s perfect day-night run.
Dec 5, 2024 · Updated Sep 28, 2026
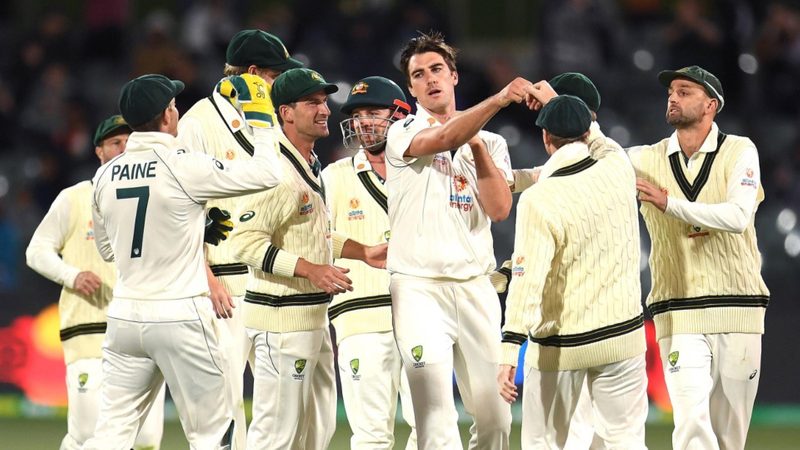
Adelaide Oval has hosted 84 men’s Tests since its first in December 1884, and for most of that time it had a reputation as one of the easiest places in Australia to bat. The pitch report has changed. Across the 15 Tests from 2000 to 2014 the average first-innings total at Adelaide was 466.1. Across the 11 since 2015, the year the ground staged the first day-night Test, it is 337.2. In the shorter formats it is still a batting ground, and still one where setting a total works.
The figures below come from every innings played at the ground, 1884 to the end of 2025, with the averages and splits worked out match by match. Adelaide has used drop-in pitches since its 2013 redevelopment.
Adelaide Oval at a glance
| Location | North Adelaide, South Australia |
| Capacity | 53,583 |
| First Test | 12 December 1884, Australia v England |
| Men’s Tests | 84 (to December 2025) |
| Men’s ODIs | 88 |
| Men’s T20Is | 13 |
| Pitch | Drop-in, since 2013 |
| Home sides | South Australia, Adelaide Strikers (BBL) |
Adelaide Oval pitch report: the Test record
The old reputation was earned. England lost the 2006 Adelaide Test after declaring on 551 for 6 in their first innings, and eight first-innings totals of 500 or more were made at the ground between 2003 and 2014. That run of scores is why the 2000-2014 average sits so high.
| Period | Tests | Avg 1st inns | Bat first W-L-D |
|---|---|---|---|
| 1884-1945 | 16 | 352.4 | 11-5-0 |
| 1946-1999 | 42 | 377.7 | 19-7-16 |
| 2000-2014 | 15 | 466.1 | 5-7-3 |
| 2015-2025 | 11 | 337.2 | 6-5-0 |
Two things changed after 2014. Draws stopped: there has not been one in the 11 Adelaide Tests since. And the ball changed colour for most of them: eight of those 11 Tests were played under lights with the pink ball. The first-innings average fell by 129.0 runs between the two periods. For comparison, the same figure at the MCG went up over the same years, from 331.7 to 340.4, so the modern MCG now produces bigger first innings than Adelaide does.
Across the full history, the side batting first at Adelaide has won 41 Tests and lost 24, with 19 draws. That edge is smaller than it looks today: since 2000 it is 11 wins, 12 defeats and three draws.
Adelaide’s pink-ball Tests: eight played, eight won by Australia
No ground has staged more day-night Tests, and Australia have won every one of them.
| Year | Opponent | Result |
|---|---|---|
| 2015 | New Zealand | Won by 3 wickets |
| 2016 | South Africa | Won by 7 wickets |
| 2017 | England | Won by 120 runs |
| 2019 | Pakistan | Won by an innings and 48 runs |
| 2020 | India | Won by 8 wickets |
| 2021 | England | Won by 275 runs |
| 2022 | West Indies | Won by 419 runs |
| 2024 | India | Won by 10 wickets |
Australia have also won their last seven Adelaide Tests in all, day and night, going back to 2019. The last side to beat them there was India, by 31 runs in December 2018. The December 2025 Ashes Test was a day match, and Australia won it by 82 runs to go 3-0 up in the series.
Adelaide Oval Test records
| Record | Figure | Player or team | Year |
|---|---|---|---|
| Highest total | 674 | Australia v India | 1948 |
| Lowest total | 36 | India v Australia | 2020 |
| Highest score | 335* | David Warner (Aus) v Pak | 2019 |
| Best bowling | 8/43 | Albert Trott (Aus) v Eng | 1895 |
| Most runs | 1,743 | Ricky Ponting (Aus) | 1996-2012 |
| Most wickets | 68 | Nathan Lyon (Aus) | 2012-25 |
Warner’s 335 not out came in the day-night Test against Pakistan in 2019, and it passed Don Bradman’s 299 not out against South Africa in 1932 as the highest Test score at the ground. Ponting’s 1,743 runs lead Allan Border (1,415) and Michael Clarke, whose 1,414 came at an average of 94.26 across ten Tests. Lyon’s 68 wickets top the list ahead of Mitchell Starc on 59. The cheapest of the leading wicket-takers is Josh Hazlewood, whose 41 wickets at Adelaide have cost 16.82 each, just ahead of Starc’s 18.06.
India at Adelaide Oval
India have played 14 Tests at Adelaide and won two. In 2003 Rahul Dravid made 233 and 72 not out as India chased 230 to win by four wickets after Australia had made 556 in their first innings. In 2018 Cheteshwar Pujara’s 123 and 71 set up a 31-run win. Nine of the other 12 were lost, including the 2020 day-night Test in which India were bowled out for 36, their lowest Test total, with Josh Hazlewood taking 5 for 8 and Pat Cummins 4 for 21.
The white-ball record is far better. India have won nine of 16 ODIs at Adelaide, lost six and tied one, though the latest, on 23 October 2025, went to Australia by two wickets after India had made 264 for 9. In T20Is Virat Kohli made 90 not out there in January 2016, and the ground also staged the 2022 T20 World Cup semi-final in which Alex Hales (86 not out) and Jos Buttler (80 not out) knocked off India’s 168 for 6 without losing a wicket.
Adelaide Oval ODI records
The side batting first has won 46 of Adelaide’s 88 ODIs and lost 40, with a tie and a no-result. Since 2010 the chase has the better of it, 11 wins to eight, while the average first-innings total has risen from 220.9 before 2000 to 249.1 since 2010.
| Record | Figure | Player or team | Year |
|---|---|---|---|
| Highest total | 369/7 | Australia v Pakistan | 2017 |
| Lowest total | 70 | Australia v New Zealand | 1986 |
| Highest score | 179 | David Warner (Aus) v Pak | 2017 |
| Best bowling | 5/16 | Carl Rackemann (Aus) v Pak | 1984 |
| Most runs | 626 | Michael Clarke (Aus) | 2003-15 |
| Most wickets | 23 | Brett Lee (Aus) | 2000-12 |
Adelaide Oval T20I and BBL: set a total
This is where Adelaide and Melbourne part company most clearly. In 13 men’s T20Is at Adelaide the side batting first has won eight, and since 2015 it is eight wins out of 11. The average first-innings total since 2015 is 177.8, against 153.5 at the MCG over the same period.
| Record | Figure | Player or team | Year |
|---|---|---|---|
| Highest total | 241/4 | Australia v West Indies | 2024 |
| Lowest total | 99/9 | Sri Lanka v Australia | 2019 |
| Highest score | 120* | Glenn Maxwell (Aus) v WI | 2024 |
| Best bowling | 4/15 | Shane Watson (Aus) v Eng | 2011 |
| Most runs | 236 | Glenn Maxwell (Aus) | 2019-24 |
| Most wickets | 9 | Adam Zampa (Aus) | 2017-24 |
Maxwell’s 120 not out came from 55 balls in February 2024, and West Indies’ reply of 207 for 9 in the same game is the third-highest total at the ground.
The Big Bash backs it up. In Adelaide’s BBL games decided without a rain adjustment, the side batting first has won 45 and the chaser 36, and the Strikers have won 45 of their 80 decided home games. The average first-innings total across all of them is 166.7, about ten runs above the MCG’s 156.8. It moves around by season: 190.8 in 2024-25, then 154.4 in 2025-26.
Is Adelaide Oval a batting pitch?
In T20 cricket, yes: first-innings totals in the high 170s since 2015 and a clear edge for the side that sets them. In Tests the honest answer is “less than it used to be”. The pink ball has taken more than a hundred runs off the average first innings since 2015, draws have disappeared, and Australia have not lost there since December 2018.
The Test cricket records page has the format-wide numbers, and our most runs in Test cricket list shows where Ponting’s career sits beyond Adelaide.
More cricket features and ground guides
Photo credit: Imago