






Sydney Cricket Ground (SCG) pitch report, Test records and stats
Australia are 15 Tests unbeaten at the SCG, level with the ground’s record run. The Sydney pitch report, every major Test record and what the numbers say about its spin reputation.
Dec 30, 2024 · Updated Sep 29, 2026
Australia have not lost a Test at the Sydney Cricket Ground since January 2011. They have gone 15 Tests unbeaten at the SCG (9 wins, 6 draws), which equals the ground’s longest home run, set between 1980 and 1993. The next Test there is the New Year’s Test against New Zealand on 4-8 January 2027, so the record is on the line in the first week of the year.
Every split below comes from the full ESPNcricinfo match list rather than an aggregator’s summary, and a couple of them argue with the ground’s reputation.
SCG at a glance
| Detail | SCG |
|---|---|
| Location | Moore Park, Sydney |
| Capacity | About 48,000 |
| Ends | Paddington End, Randwick End |
| Home teams | Australia, New South Wales, Sydney Sixers |
| First Test | 17 February 1882, v England |
| Men’s Tests | 114 |
| First ODI | 13 January 1979, v England |
| First T20I | 9 January 2007, v England |
The Test count needs a footnote. ESPNcricinfo’s total of 114 includes the Super Test between Australia and an ICC World XI in October 2005, which the ICC gave Test status. Lists that leave that match out say 113.
SCG pitch report: what does the Sydney surface do?
The SCG square is built on Bulli soil, and its reputation is the most spin-friendly Test pitch in Australia.
The numbers only half agree. Since 2015 the first-innings average in SCG Tests is 414.4 across 12 matches, the highest of any era at the ground, and 6 of those 12 Tests were drawn. That is a batting pitch for three days. But the side batting first has lost each of the last three, all three won by Australia batting second: against Pakistan (2024), India (2025) and England (2026).
The spin reputation also belongs to specific bowlers more than to spin in general. Stuart MacGill took 53 wickets here in 8 Tests at 24.47, and Shane Warne 64 at 28.12. Nathan Lyon, Australia’s most successful off-spinner, has 49 SCG wickets at 39.20 in 14 Tests, a worse average than he has at the Gabba, the ground with the fast-bowling reputation.
How has the SCG pitch changed across eras?
| Era | Tests | 1st-inns avg | Bat first W-L-D |
|---|---|---|---|
| 1882-1945 | 35 | 298.3 | 21-14-0 |
| 1946-1999 | 50 | 302.5 | 17-17-16 |
| 2000-2014 | 17 | 345.2 | 7-9-1 |
| 2015-2026 | 12 | 414.4 | 2-4-6 |
Across all 114 Tests the side batting first has won 47, lost 44 and drawn 23. Batting first was worth something before the Second World War, when every SCG Test produced a result. Since 2000 it has been worth nothing: the table shows the side batting first behind in both modern eras.
So what is a par first innings? Since 2000, a side batting first that reached 400 at the SCG has won 5, drawn 5 and lost 1 of 11 Tests. Below 400 it has lost 12 of 18. The one side to make 400 batting first and still lose was South Africa, with 451/9d in 2006, the match Australia won with the ground’s record chase.
SCG Test records
| Record | Figure | By | Match |
|---|---|---|---|
| Highest total | 705/7d | India | v Australia, 2004 |
| Lowest total | 42 | Australia | v England, 1888 |
| Highest chase | 288/2 | Australia | v South Africa, 2006 |
| Highest score | 329* | Michael Clarke | v India, 2012 |
| Best bowling | 8/35 | George Lohmann | v Australia, 1887 |
India hold the ground’s highest total, 705/7d in January 2004, built on Sachin Tendulkar’s 241 not out and VVS Laxman’s 178. Michael Clarke’s 329* against India in January 2012 is the highest individual score, and the highest successful chase is Australia’s 288/2 against South Africa in January 2006, when Ricky Ponting made a hundred in each innings of his 100th Test. George Lohmann’s 8/35 in 1887 is still the best innings return, and the only eight-wicket haul at the ground since 1898 is Anil Kumble’s 8/141 in that 2004 Test.
Most Test runs and wickets at the SCG
| Batter | Tests | Runs | Average |
|---|---|---|---|
| Ricky Ponting | 16 | 1480 | 67.27 |
| Steve Smith | 13 | 1246 | 65.57 |
| Allan Border | 17 | 1177 | 56.04 |
| Greg Chappell | 12 | 1150 | 63.88 |
| David Boon | 11 | 1127 | 62.61 |
| Bowler | Tests | Wickets | Average |
|---|---|---|---|
| Shane Warne | 14 | 64 | 28.12 |
| Stuart MacGill | 8 | 53 | 24.47 |
| Glenn McGrath | 12 | 50 | 23.44 |
| Nathan Lyon | 14 | 49 | 39.20 |
| Charlie Turner | 6 | 45 | 13.37 |
Ponting’s 1480 runs lead the list, with Steve Smith 234 behind. Every name on both tables is Australian. For the career picture see our list of the most runs in Test cricket.
India’s record at the SCG
India have played 14 Tests at the SCG and won 1, in January 1978. They have drawn 7 and lost 6, including the last one, in January 2025. The draws include some of India’s better days in Australia: the 705/7 declared in 2004 and the fifth-day rearguard of January 2021, when Hanuma Vihari and R Ashwin batted out the last 42 overs together to save the match.
Australia’s unbeaten run at the SCG since 2012
| Season | Opponent | Result |
|---|---|---|
| 2011-12 | India | Won |
| 2012-13 | Sri Lanka | Won |
| 2013-14 | England | Won |
| 2014-15 | India | Draw |
| 2015-16 | West Indies | Draw |
| 2016-17 | Pakistan | Won |
| 2017-18 | England | Won |
| 2018-19 | India | Draw |
| 2019-20 | New Zealand | Won |
| 2020-21 | India | Draw |
| 2021-22 | England | Draw |
| 2022-23 | South Africa | Draw |
| 2023-24 | Pakistan | Won |
| 2024-25 | India | Won |
| 2025-26 | England | Won |
SCG ODI and T20I records
| Record | Figure | By | Year |
|---|---|---|---|
| Highest ODI total | 408/5 | South Africa | 2015 |
| Highest ODI score | 164 | Steve Smith | 2016 |
| Best ODI bowling | 5/15 | Greg Chappell | 1981 |
| Highest T20I total | 221/5 | Australia | 2007 |
| Highest T20I score | 124* | Shane Watson | 2016 |
| Best T20I bowling | 5/26 | Spencer Johnson | 2024 |
The SCG has hosted 162 ODIs in which a ball was bowled. The side batting first has won 92 and the chaser 63, with 7 no-results, and since 2010 it is 15 wins batting first to 11 chasing. AB de Villiers’ 162* off 66 balls against West Indies at the 2015 World Cup came in the ground’s highest ODI total.
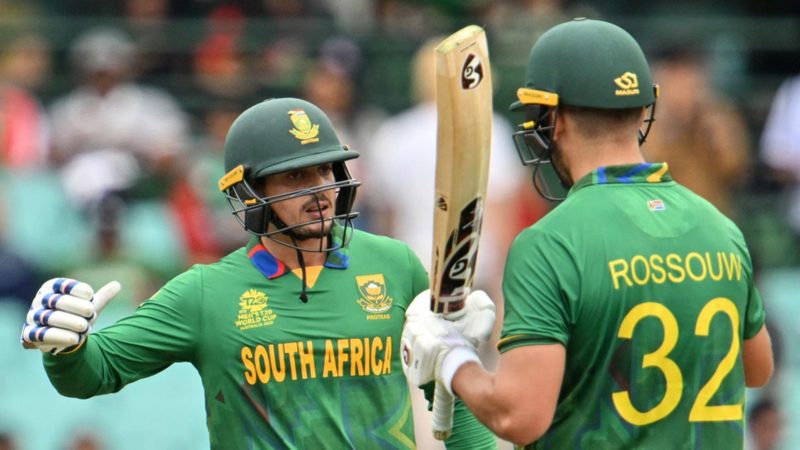
In 19 T20Is the side batting first has won 10 and lost 7, with one tie. Virat Kohli has 298 T20I runs at the SCG at an average of 99.33, more than anyone else, from 5 matches. The second-highest T20I score at the ground is Rilee Rossouw’s 109 off 56 balls against Bangladesh at the 2022 T20 World Cup, when South Africa made 205/5.
SCG in the Big Bash League
The SCG is home to the Sydney Sixers, and across the 70 BBL matches Cricsheet records there, the chasing side has won 33 and the side batting first 28 (results decided without a rain rule). The average first-innings total in those games is 159.2, against 170.2 at the Gabba, so Brisbane is the better batting ground of the two in the Big Bash.
SCG FAQs
Is the SCG pitch good for batting or bowling?
Both, in order. Recent SCG Tests have averaged 414.4 in the first innings, so batting is easy early, and the side batting second has still won the last three as the surface wears. Spinners get turn later in the match, although Nathan Lyon averages 39.20 here.
What is the highest Test score at the SCG?
The highest team total is India’s 705/7d in 2004. The highest individual score is Michael Clarke’s 329 not out against India in 2012.
Has India ever won a Test at the SCG?
Once, by an innings and two runs in January 1978. India’s record there is 1 win, 7 draws and 6 defeats from 14 Tests.
For the other big Australian Test grounds, read our records pages for the MCG, Adelaide Oval and the Gabba.
Photo credit: Imago