






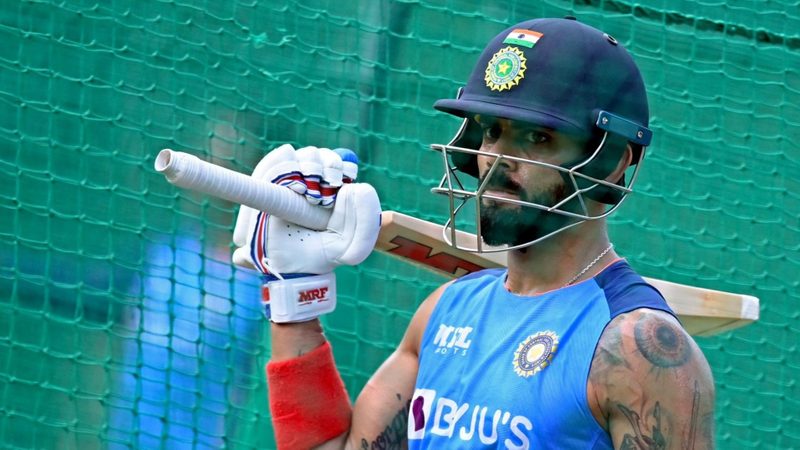
Virat Kohli has the highest batting average in men’s T20 internationals: 48.69, from 4,188 runs in 125 matches. He is the only batter with 1,000 or more T20I runs to average above 48. Figures complete to 15 September 2026; source ESPNcricinfo.
A batting average is the total runs scored divided by the number of times the batter has been dismissed. In T20, where innings are short and not-outs are common, it rewards batters who finish innings as much as those who score heavily — Kohli was not out 31 times in 117 innings, and those unbeaten scores lift the figure considerably.
Because of that, an average list is only meaningful once you set a minimum. Without one it fills up with players who have batted a handful of times. The table below uses a cut-off of 1,000 T20I runs, and it is stated on every claim on this page.
Highest batting average in T20Is
All batters with 1,000 or more runs in men’s T20 internationals, ranked by average. Complete to 15 September 2026.
| Rank | Player | Team | Span | Mat | Runs | Ave | SR | 100s/50s |
|---|---|---|---|---|---|---|---|---|
| 1 | Virat Kohli | India | 2010-2024 | 125 | 4,188 | 48.69 | 137.04 | 1/38 |
| 2 | Mohammad Rizwan | Pakistan | 2015-2024 | 106 | 3,414 | 47.41 | 125.37 | 1/30 |
| 3 | Karanbir Singh | Austria | 2024-2026 | 65 | 2,616 | 45.89 | 174.28 | 4/20 |
| 4 | Tilak Varma | India | 2023-2026 | 60 | 1,648 | 44.54 | 144.94 | 2/9 |
| 5 | Sami Sohail | Malawi | 2019-2026 | 75 | 2,192 | 42.98 | 125.61 | 0/14 |
| 6 | Jonathan Baker | Cayman Islands | 2024-2026 | 28 | 1,031 | 42.95 | 131.00 | 0/10 |
| 7 | Sohail Ahmed | Bahrain | 2022-2026 | 81 | 1,983 | 42.19 | 118.24 | 0/16 |
| 8 | Delray Rawlins | Bermuda | 2019-2026 | 45 | 1,359 | 41.18 | 151.16 | 1/10 |
| 9 | Adil Butt | Eswatini | 2022-2026 | 36 | 1,355 | 41.06 | 166.25 | 3/10 |
| 10 | Matthew Stokes | Guernsey | 2019-2026 | 55 | 1,368 | 40.23 | 124.36 | 1/7 |
Every ICC member’s men’s team has held full T20I status since 2018, so an all-inclusive list like this one now carries several Associate batters who face weaker attacks than the Test nations do. That is not a criticism of them — it is a reason to read the next table alongside this one.
Highest T20I average among the Test-playing nations
The same 1,000-run cut-off, restricted to the twelve Full Member sides. Complete to 15 September 2026.
| Rank | Player | Team | Span | Mat | Runs | Ave | SR |
|---|---|---|---|---|---|---|---|
| 1 | Virat Kohli | India | 2010-2024 | 125 | 4,188 | 48.69 | 137.04 |
| 2 | Mohammad Rizwan | Pakistan | 2015-2024 | 106 | 3,414 | 47.41 | 125.37 |
| 3 | Tilak Varma | India | 2023-2026 | 60 | 1,648 | 44.54 | 144.94 |
| 4 | Babar Azam | Pakistan | 2016-2026 | 145 | 4,596 | 38.94 | 128.02 |
| 5 | JP Duminy | South Africa | 2007-2019 | 81 | 1,934 | 38.68 | 126.24 |
| 6 | Kevin Pietersen | England | 2005-2013 | 37 | 1,176 | 37.93 | 141.51 |
| 7 | KL Rahul | India | 2016-2022 | 72 | 2,265 | 37.75 | 139.12 |
| 8 | MS Dhoni | India | 2006-2019 | 98 | 1,617 | 37.60 | 126.13 |
| 9 | Faf du Plessis | South Africa | 2012-2020 | 47 | 1,466 | 36.65 | 134.24 |
| 10 | Dawid Malan | England | 2017-2023 | 62 | 1,892 | 36.38 | 132.49 |
Kohli leads this list too, and by a wider margin than the raw numbers suggest: he is the only batter on it who combines an average near 50 with more than 4,000 runs. Babar Azam has scored more T20I runs than anyone, but averages almost ten fewer.
Why Kohli’s average is so high
Three things, and only the first is about run-scoring.
He was not out a lot. 31 not-outs in 117 innings is a rate of one in every 3.8 trips to the crease, which is high for a top-order batter and reflects how often he was still there at the end.
He rarely failed. Kohli was dismissed for a duck seven times in 117 T20I innings. Across the same career he made 38 fifties and one hundred, so exactly one innings in three — 39 of 117 — passed fifty.
He batted where the overs are. Kohli came in at No. 3 in 80 of his 117 T20I innings, which in a 20-over game gives a batter time to build. His strike rate of 137.04 shows he did not trade tempo for it.
Kohli’s T20I career, start to finish
Kohli made his T20I debut against Zimbabwe at Harare on 12 June 2010, finishing 26 not out from 21 balls. His last T20 international was the 2024 T20 World Cup final against South Africa at Bridgetown on 29 June 2024, where he made 76 from 59 balls. India won, and he retired from the format immediately afterwards.
| Mat | Inns | NO | Runs | HS | Ave | SR | 100s | 50s | Ducks |
|---|---|---|---|---|---|---|---|---|---|
| 125 | 117 | 31 | 4,188 | 122* | 48.69 | 137.04 | 1 | 38 | 7 |
His one T20I hundred is 122 not out against Afghanistan at Dubai in the 2022 Asia Cup. His 38 fifties are one behind Babar Azam’s 39.
One thing worth correcting, because it was true for years and is not any more: Kohli is no longer the leading run-scorer in T20 internationals. He is fourth on 4,188, behind Babar Azam (4,596), Rohit Sharma (4,231) and Jos Buttler (4,212). Babar passed him in 2024 while Kohli and Rohit were retiring from the format.
Highest T20I batting average: quick answers
Who has the highest batting average in T20 internationals? Virat Kohli, on 48.69 among batters with 1,000 or more T20I runs.
What is Virat Kohli’s T20I average? 48.69, from 4,188 runs in 125 matches at a strike rate of 137.04.
Who is second? Mohammad Rizwan of Pakistan, on 47.41 from 3,414 runs.
Does Kohli have the most T20I runs? No. He is fourth on 4,188; Babar Azam leads with 4,596.
Is Kohli still playing T20 internationals? No. He retired from the format after the 2024 T20 World Cup final and now plays ODIs only.
Why does the list use a 1,000-run minimum? Without one, an average table is topped by batters who have been dismissed only two or three times, which tells you nothing about how good they are.
See also our lists of the most runs in T20 internationals, every Virat Kohli century and our look at whether Kohli is the new God of cricket.
Follow us on Telegram for the latest updates from the world of sports!
Interested in cricket betting? Click here to check out the list of top sites.
Featured photo: AFP