




Melbourne Cricket Ground (MCG): pitch report, records and stats
The MCG has hosted 118 Tests since the first ever in 1877. This is its pitch report, the full records in every format, and what the numbers say about batting first.
Dec 25, 2022 · Updated Sep 28, 2026
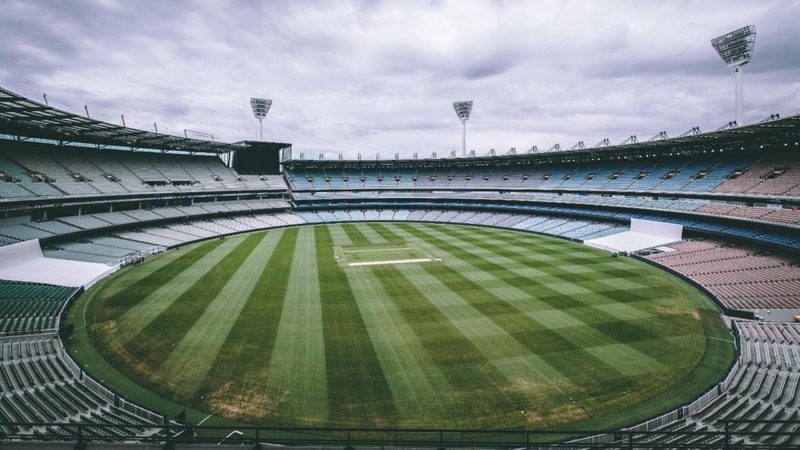
The Melbourne Cricket Ground staged the first Test ever played, in March 1877, and it has hosted 118 men’s Tests since, every one of them involving Australia. It holds 100,024 people, which makes it the largest cricket ground in Australia and second in the world to Ahmedabad. For the pitch, the short answer is that the MCG rarely produces a draw, it has scored more heavily in recent Tests than its reputation suggests, and in white-ball cricket it has been a ground for chasing.
Every number below comes from the full match list for the ground, 1877 to the end of 2025, and the averages were worked out from each innings rather than copied from a summary. The MCG has used drop-in pitches since 1996.
MCG at a glance
| Location | Yarra Park, Melbourne, Victoria |
| Capacity | 100,024 |
| First Test | 15 March 1877, Australia v England |
| Men’s Tests | 118 (to December 2025) |
| Men’s ODIs | 152 |
| Men’s T20Is | 20 |
| Pitch | Drop-in, since 1996 |
| Home sides | Victoria, Melbourne Stars (BBL) |
MCG pitch report: what the Test record says
The number that sets the MCG apart is how few of its Tests are drawn. Only 17 of the 118 have ended level, about one in seven. Across the rest, the side batting first has won 58 and lost 43.
That first-innings edge has gone in the modern game. Since 2000 the MCG has staged 26 Tests, and the team batting first has won 11 and lost 13, with two draws. The ground still rewards a big first innings when a side makes one, but losing the toss at the MCG has not been a handicap for a quarter of a century.
Scoring has not fallen either. The average first-innings total across the 15 Tests from 2000 to 2014 was 331.7. Across the 11 since 2015 it is 340.4. That is the opposite of what has happened at Adelaide Oval, where the same figure has dropped by more than 100 runs.
| Period | Tests | Avg 1st inns | Bat first W-L-D |
|---|---|---|---|
| 1877-1945 | 36 | 287.9 | 22-12-2 |
| 1946-1999 | 56 | 310.5 | 25-18-13 |
| 2000-2014 | 15 | 331.7 | 6-8-1 |
| 2015-2025 | 11 | 340.4 | 5-5-1 |
The exception is the one everybody remembers. The Boxing Day Test of December 2025 was over inside two days: Australia made 152 and 132, England 110 and 178 for 6, and England won by four wickets for their first Test win in Australia in 15 years. Twenty wickets fell on the first day. The ICC match referee, Jeff Crowe, rated the pitch “unsatisfactory”, which carries one demerit point, after the previous three Boxing Day pitches had been rated “very good”. One green surface does not rewrite a 118-Test record. It does show that a drop-in pitch is only as predictable as the grass left on it.
MCG Test records
| Record | Figure | Player or team | Year |
|---|---|---|---|
| Highest total | 624/8d | Australia v Pakistan | 2016 |
| Lowest total | 36 | South Africa v Australia | 1932 |
| Highest score | 307 | Bob Cowper (Aus) v Eng | 1966 |
| Best bowling | 9/86 | Sarfraz Nawaz (Pak) v Aus | 1979 |
| Most runs | 1,671 | Don Bradman (Aus) | 1928-48 |
| Most wickets | 82 | Dennis Lillee (Aus) | 1972-83 |
Bradman’s 1,671 runs came from only 11 Tests at an average of 128.53, including 270 against England in January 1937. Ricky Ponting (1,338), Steve Waugh (1,284) and Steve Smith (1,279) sit behind him, and Smith is the one still adding to his total. Lillee’s 82 wickets lead Shane Warne’s 56 and Nathan Lyon’s 50.
Sarfraz’s 9 for 86 in March 1979 won Pakistan the match by 71 runs, and he took seven of those wickets for one run in a spell of 33 balls. Arthur Mailey’s 9 for 121 in 1921 is the only other nine-wicket innings at the ground.
Australia’s own record at the MCG reads 68 wins, 33 defeats and 17 draws. Their highest total there, the 624 for 8 declared, came against Pakistan in December 2016.
India at the MCG
India have played 15 Tests at the MCG and won four: by 222 runs in 1977, by 59 runs in 1981, by 137 runs in 2018 and by eight wickets in 2020. The last two came in back-to-back Boxing Day Tests. In 2018 Jasprit Bumrah took 6 for 33 to bowl Australia out for 151 in their first innings, and in 2020 Ajinkya Rahane, captaining after India had been bowled out for 36 in Adelaide, made 112. The 2024 visit ended in defeat, and India have lost nine MCG Tests in all, with two draws.
In white-ball cricket India’s MCG record is much kinder. They have won 11 and lost 11 of 22 ODIs there, including the January 2019 game in which Yuzvendra Chahal took 6 for 42, and they have won four of seven T20Is. The best of those wins came at the 2022 T20 World Cup, when Virat Kohli’s 82 not out from 53 balls beat Pakistan on the last ball in front of a packed ground. The most recent visit, on 31 October 2025, went the other way: India were bowled out for 125 despite 68 from 37 balls by Abhishek Sharma, Josh Hazlewood took 3 for 13, and Australia won by four wickets with 40 balls left.
MCG ODI records
The MCG has hosted 152 men’s ODIs, and the split between batting first and chasing is as even as it could be: 73 wins for the side batting first, 75 for the chaser, one tie and three no-results. Since 2010 it is exactly 12 each. What has changed is the size of the target. The average first-innings total before 2000 was 206.9; across the 24 ODIs since 2010 it is 271.5.
| Record | Figure | Player or team | Year |
|---|---|---|---|
| Highest total | 355/5 | Australia v England | 2022 |
| Lowest total | 94 | England v Australia | 1979 |
| Highest score | 180 | Jason Roy (Eng) v Aus | 2018 |
| Best bowling | 6/42 | Agarkar (Ind), Chahal (Ind) | 2004, 2019 |
| Most runs | 2,108 | Ricky Ponting | 1995-2012 |
| Most wickets | 46 | Shane Warne | 1993-2005 |
Both men’s ODI World Cup finals staged in Australia have been played at the MCG. Pakistan beat England by 22 runs there in 1992, and Australia beat New Zealand by seven wickets in 2015.
MCG T20I and BBL: a chasing ground
In T20 cricket the MCG leans clearly towards the side batting second. Of the 19 men’s T20Is with a result, the chasing side has won 12. Since 2015 it is eight wins to three. The first-innings average across those 19 games is 144.3, and only three totals of more than 180 have been made there.
The Big Bash tells the same story over a larger sample. In the MCG’s BBL games decided without a rain adjustment, the side chasing has won 45 and the side batting first 28. Adelaide, the other big BBL ground, runs the other way (45 wins batting first against 36 chasing), which makes the pair a useful comparison on any Big Bash night.
| Record | Figure | Player or team | Year |
|---|---|---|---|
| Highest total | 186/5 | India v Zimbabwe | 2022 |
| Lowest total | 74 | India v Australia | 2008 |
| Highest score | 89 | David Warner (Aus) v SA | 2009 |
| Best bowling | 4/30 | Josh Hazlewood (Aus) v Eng | 2014 |
| Most runs | 334 | Aaron Finch (Aus) | 2011-22 |
| Most wickets | 9 | Kane Richardson (Aus) | 2018-22 |
The 2022 T20 World Cup final was played here too, and it fitted the pattern: Sam Curran took 3 for 12 as Pakistan were held to 137 for 8, and England chased it down.
Is the MCG a batting or bowling pitch?
In Tests it is a result pitch that has become slightly better for batting, not worse, with a first-innings average of 340.4 since 2015 and almost no draws. The toss matters less than it did before 2000. In ODIs it is neutral, and in T20Is and the BBL it favours the chase, with first-innings totals that run about ten runs lower than Adelaide’s in the Big Bash (156.8 against 166.7).
For more on the ground’s size against the rest of the world, see our list of the biggest cricket stadiums in the world. For the format-wide picture, the Test cricket records and ODI cricket records pages put these numbers in context.
Photo credit: Alamy