






Hagley Oval pitch report: Test, ODI and T20I records and stats in Christchurch
Fourteen of the 15 captains who won the toss in a Hagley Oval Test chose to bowl, and the side batting first has won four. Every Christchurch record, format by format.
Mar 6, 2024 · Updated Sep 30, 2026
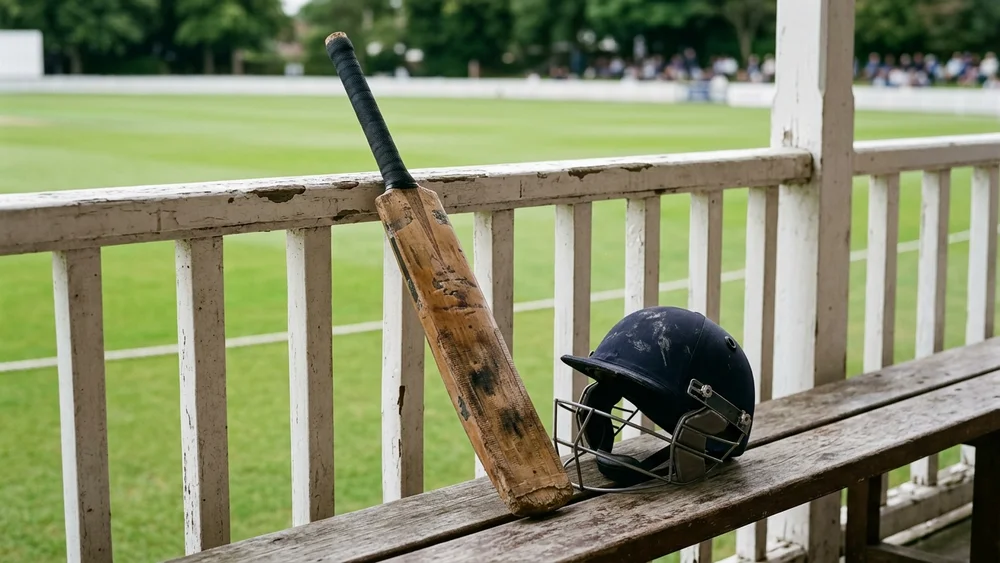
Hagley Oval is where captains go to bowl. In 15 Tests at the Christchurch ground, 14 captains have won the toss and put the other side in, and the side batting first has won only four of those matches. That single habit explains most of this Hagley Oval pitch report, and it holds up across the numbers below, from the first Test in December 2014 to the West Indies rearguard in December 2025.
The ground sits inside Hagley Park and became Christchurch’s international venue after the 2011 earthquake ruined Lancaster Park. It has since staged the opening match of the 2015 men’s World Cup and the 2022 Women’s World Cup final. All figures here are men’s internationals unless marked, and come from the ESPNcricinfo Statsguru records for the ground.
Hagley Oval pitch report: why everyone bowls first
Captains read the Test pitch as one that helps seamers on the first morning and gets easier to bat on. The results mostly back them.
| Format | Matches | Toss-winners who bowled | Side batting first |
|---|---|---|---|
| Tests | 15 | 14 | Won 4, lost 9, drew 2 |
| ODIs | 17 | 11 | Won 9, lost 7, 1 no result |
| T20Is | 15 | 11 | Won 6, lost 8, 1 no result |
Of the 13 Hagley Oval Tests that produced a result, the captain who won the toss finished on the winning side in 10. The average first-innings total is 288.9, which sounds healthy until you see how the second innings then goes: sides batting second have made 659/6d, 482 and 499 here, while two first-day line-ups were dismissed for under 140.
The one captain who batted first after winning the toss did win. South Africa took first use of the pitch in February 2022, made 364, and levelled the series by 198 runs eight days after being bowled out for 95 on the same ground.
Hagley Oval Test records
| Record | Figure | Match |
|---|---|---|
| Highest total | 659/6d | New Zealand v Pakistan, 2021 |
| Lowest total | 95 | South Africa v New Zealand, 2022 |
| Highest score | 252 | Tom Latham v Bangladesh, 2022 |
| Best innings bowling | 7/23 | Matt Henry v South Africa, 2022 |
| Best match bowling | 11/117 | Kyle Jamieson v Pakistan, 2021 |
| Highest fourth innings | 457/6 (draw) | West Indies v New Zealand, 2025 |
| Highest chase to win | 285/8 | New Zealand v Sri Lanka, 2023 |
New Zealand’s home record here is strong: nine wins, four defeats and two draws from 15 Tests. Three of the wins came by an innings, the biggest by an innings and 276 runs over South Africa in 2022, when Matt Henry took 7/23 on the opening day.
Three matches stand apart. Brendon McCullum reached a hundred from 54 balls against Australia in February 2016, in his final Test, and nobody has made a faster Test century since. In March 2023, Kane Williamson finished 121 not out as New Zealand chased 285 against Sri Lanka and won off the last ball, with a bye. And in December 2025, West Indies were set 531, batted 163.3 overs and finished on 457/6 for a draw. Justin Greaves made 202 not out from 388 balls, with Kemar Roach 58 not out beside him.
Most Test runs at Hagley Oval
| Batter | Tests | Runs | Average |
|---|---|---|---|
| Tom Latham (NZ) | 15 | 1299 | 49.96 |
| Kane Williamson (NZ) | 12 | 979 | 48.95 |
| Henry Nicholls (NZ) | 11 | 662 | 44.13 |
| Daryl Mitchell (NZ) | 7 | 553 | 55.3 |
| Colin de Grandhomme (NZ) | 7 | 460 | 57.5 |
Most Test wickets at Hagley Oval
| Bowler | Tests | Wickets | Average |
|---|---|---|---|
| Tim Southee (NZ) | 14 | 63 | 23.74 |
| Trent Boult (NZ) | 9 | 53 | 21.09 |
| Matt Henry (NZ) | 8 | 40 | 23.32 |
| Neil Wagner (NZ) | 11 | 37 | 28.43 |
| Kyle Jamieson (NZ) | 5 | 28 | 17.57 |
Tim Southee’s 63 wickets came from 14 Tests. Trent Boult took 53 from nine at a better average, 21.09, and Kyle Jamieson’s 28 from five came at 17.57, the best of any bowler with 20 or more here.
India at Hagley Oval
India have played one Test at the ground and lost it. In February and March 2020 they were bowled out for 242 and 124 and New Zealand won by seven wickets to take the series 2-0. Kyle Jamieson took 5/45 in the first innings and Trent Boult 4/28 in the second. India’s only ODI there, in November 2022, was washed out with New Zealand on 104/1 chasing 220, after Washington Sundar’s 51 had carried India to 219.
Hagley Oval ODI records
The white-ball pitch plays differently. In 17 ODIs the side batting first has won nine and lost seven, and the average first-innings score is 258.9. The toss has almost no pull: the captain who won it has been on the winning side in only five of the 16 results.
| Record | Figure | Match |
|---|---|---|
| Highest total | 341/9 and 341/7 | Scotland v Canada, 2014; New Zealand v Bangladesh, 2016 |
| Lowest all-out total | 117 | Sri Lanka v New Zealand, 2015 |
| Highest score | 175 | Calum MacLeod v Canada, 2014 |
| Best bowling | 7/34 | Trent Boult v West Indies, 2017 |
Totals of 300 or more have been made six times, all by the side batting first, and all six won. New Zealand’s 331/6 against Sri Lanka opened the 2015 World Cup here. The quickest finish came in December 2015, when Sri Lanka were all out for 117 and Martin Guptill made 93 not out from 30 balls as New Zealand won by ten wickets in 8.2 overs.
| Batter | ODIs | Runs | Highest |
|---|---|---|---|
| Martin Guptill (NZ) | 8 | 421 | 118 |
| Tom Latham (NZ) | 12 | 384 | 137 |
| Kane Williamson (NZ) | 7 | 251 | 69 |
| Ross Taylor (NZ) | 7 | 246 | 102* |
| Bowler | ODIs | Wickets | Best |
|---|---|---|---|
| Trent Boult (NZ) | 9 | 18 | 7/34 |
| Matt Henry (NZ) | 8 | 13 | 4/33 |
| Mitchell Santner (NZ) | 9 | 11 | 3/15 |
| Lockie Ferguson (NZ) | 5 | 10 | 3/17 |
The women’s game has its own history at the ground. Alyssa Healy made 170 in the 2022 World Cup final as Australia posted 356/5 and beat England by 71 runs, the highest score by anyone in a World Cup final. New Zealand Women’s 455/5 against Pakistan in 1997 is still the highest women’s ODI total on the ground.
Hagley Oval T20I records
T20Is lean the other way from the ODIs. The chasing side has won eight of the 14 completed games, 11 of the 15 captains who won the toss chose to field, and the average first-innings score is 162.0. Seven of the 15 matches were played in one October 2022 tri-series between New Zealand, Pakistan and Bangladesh.
| Record | Figure | Match |
|---|---|---|
| Highest total | 236/4 | England v New Zealand, 2025 |
| Lowest total | 91 | Pakistan v New Zealand, 2025 |
| Highest score | 99* | Devon Conway v Australia, 2021 |
| Best bowling | 4/14 | Jacob Duffy v Pakistan, 2025 |
England’s 236/4 in October 2025 is the only T20I total above 210 here, and they won by 65 runs. At the other end, Pakistan were all out for 91 in March 2025 and New Zealand needed 10.1 overs to get the runs.
| Batter | T20Is | Runs | Strike rate |
|---|---|---|---|
| Devon Conway (NZ) | 6 | 332 | 133.87 |
| Mohammad Rizwan (PAK) | 7 | 329 | 124.15 |
| Glenn Phillips (NZ) | 8 | 256 | 154.21 |
| Babar Azam (PAK) | 7 | 224 | 117.89 |
| Bowler | T20Is | Wickets | Economy |
|---|---|---|---|
| Ish Sodhi (NZ) | 9 | 12 | 8.47 |
| Tim Southee (NZ) | 9 | 12 | 7.33 |
| Michael Bracewell (NZ) | 8 | 10 | 6.07 |
| Mohammad Nawaz (PAK) | 7 | 8 | 8.37 |
For the bigger picture, our Test cricket records and ODI records pages cover the all-time lists, and McCullum’s innings sits at the top of our list of the fastest Test centuries. Across the Tasman, we have the same breakdown for the SCG and the Gabba.